

image by Marc Schaefer
So what is DCA? It stands for dollar cost average (DCA) and it is a simple investment strategy which involves buying an asset at set intervals (daily, weekly, monthly, etc.) to remove the anxiety of buying when market swings make it seem like it would be disadvantageous to buy (e.g. I buy $15 gold every day at the same time no matter what the price). So the simple strategy is:
Buy $15.00 (or your chosen amount) of gold (your chosen asset) every day/week/month
There are many flavours (let’s call them enhancements) to this strategy, however to ensure we pick the best one, we should always compare return on investment (ROI) percentages. It’s also worth back testing the simple and the enhanced versions with different moving averages, frequencies and amounts invested to ensure optimal returns. At the end of the day, its always best to DYOR.
So what are some of these alternatives to the simple DCA method? Buying when:
the price is below 90 Day Simple Moving Average (SMA)
90 Day SMA is trending downwards (less than the day before)
the relative strength index RSI (90) is less than 50
So why 90 Days? 90 day moving averages is 3 months of data (i.e. 1 quarter). From the different scenarios, compared to the traditional 50, 100 and 200 Day SMAs; using the 90 day SMA has generally resulted in producing higher ROIs. So unless stated, I will be using 90 days.
Simple DCA Strategy
The best way to understand this is normally with some examples, so lets start with the simple DCA strategy. Simply take $15 dollars and DCA it into gold every day regardless of price for 5 years (our gold data has been taken from trading view, from the 1st Aug 2016 until 27th Aug 2021, using Comex: Gold futures quoted in US dollars).
So here are the headline numbers, after investing $15 dollars every day, 5 days week, for just over 5 years (no weekend trading in the traditional markets):
Asset Accumulated: 13.46oz
Total Value: 24,183.53
Invested: 19,170.00
Profit: 5,013.53
ROI%: 26.15%
Cash on Hand: $0.00
Approx Yearly % Return: 5.23%
So saving $15 a day ($450 month) with this really simple strategy, in one of the most volatile assets around (big smiley face) gives you an average of 5.23% a year (26.15% in 5 years) - no wonder it is such a popular strategy. Its a pity nobody knows how well gold has performed compared to bonds, which today return less than 1%, and some even have negative rates (a guarantee that you will lose money - sounds like a brilliant investment idea).
Anyway, lets not go down that road here, I’m happy with a strategy returning 5.23% holding an assets that keeps its value over the long term (i.e. protects your purchasing power), is there anyway we can improve this strategy. Let’s look at the enhanced versions:
Price is below 90 Day Simple Moving Average (MA)
I’ve tried to show how this strategy works, and like the simple strategy is is very easy to execute. When the close price is below the 90 SMA (the yellow line), buy the asset. See the yellow boxes below for an idea of when you would buy the asset. On the day that this condition is not met, take your (daily, weekly, monthly) investment amount and put into a cash account.

Closing Price is below the 90 Day SMA
Back to the analysis, lets buy $15 of gold every day our closing price is less than the 90D SMA (yellow boxes) for the same period as earlier (1st Aug 2016 until 27th Aug 2021) and when the condition is not met, we suspend our DCA buys and accumulate those $15 daily contributions.
Here are the results of this approach:
Asset Accumulated: 5.60oz
Total Value: $10,068.17
Invested: $7,770.00
Profit: $2,298.17
ROI%: 29.58%
Cash on Hand: $11,400.00
~Yearly % Return: 5.92%
So by adjusting the simple strategy slightly (let’s be honest, its still very simple), we have managed to extract 1.13x the return. That might not seem like much, but on $1.0m invested you would make an extra $130,000 using this strategy (i.e. DCAing only when the closing price is below the 90 day simple moving average).
Next we move onto another enhancement, this one is slightly more complicated, and a DCA strategy which also uses the 90 day SMA.
90 Day SMA is trending downwards (less than the day before)
Again, I’ve tried to show how this strategy works with a simple chart. In the chart below, look for the 3 lines with arrows pointing down. This is where the 90D SMA (yellow line) is trending down and this is where you will buy. You don’t worry where the price is relative to the 90D SMA, you just buy when the SMA is in a negative slope (trending down) and again when this condition isn’t met, suspend your DCA buys and accumulate those daily contributions in a cash account.

90 Day SMA is trending downwards
Again, I have uploaded the data in our back testing sheet, where we bought $15 of gold every day when our 90D SMA was trending down for the 5 years (1st Aug 2016 until 27th Aug 2021). The results were again impressive and this again produced an improvement:
Asset Accumulated: 4.73oz
Total Value: $8,502.90
Invested: $6,465.00
Profit: $2,037.90
ROI%: 31.52%
Cash on Hand: $12,705.00
~Yearly % Return: 6.30%
Isn’t it interesting to to see that not only do we have a better ROI%, but we have a significant amount of cash on hand. For the data set we used, there where 1278 days to invest, and the condition was only met 431 days. Importantly though, the buying happens on days that produce more alpha in the long term, hence the approx 6.3% per year (on gold, yes on gold)!
I might be losing you, the gin is finished, but I too need to finish. And I’ve left the best for last:
buying when RSI (90D Close) is less than 50
This is my personal favourite, because it is really very easy. RSI above 50, put your cash aside, RSI below 50, buy. Most good charting platforms give you a RSI reading, simply set it to 90 on CLOSE (this is a step that can not be missed).
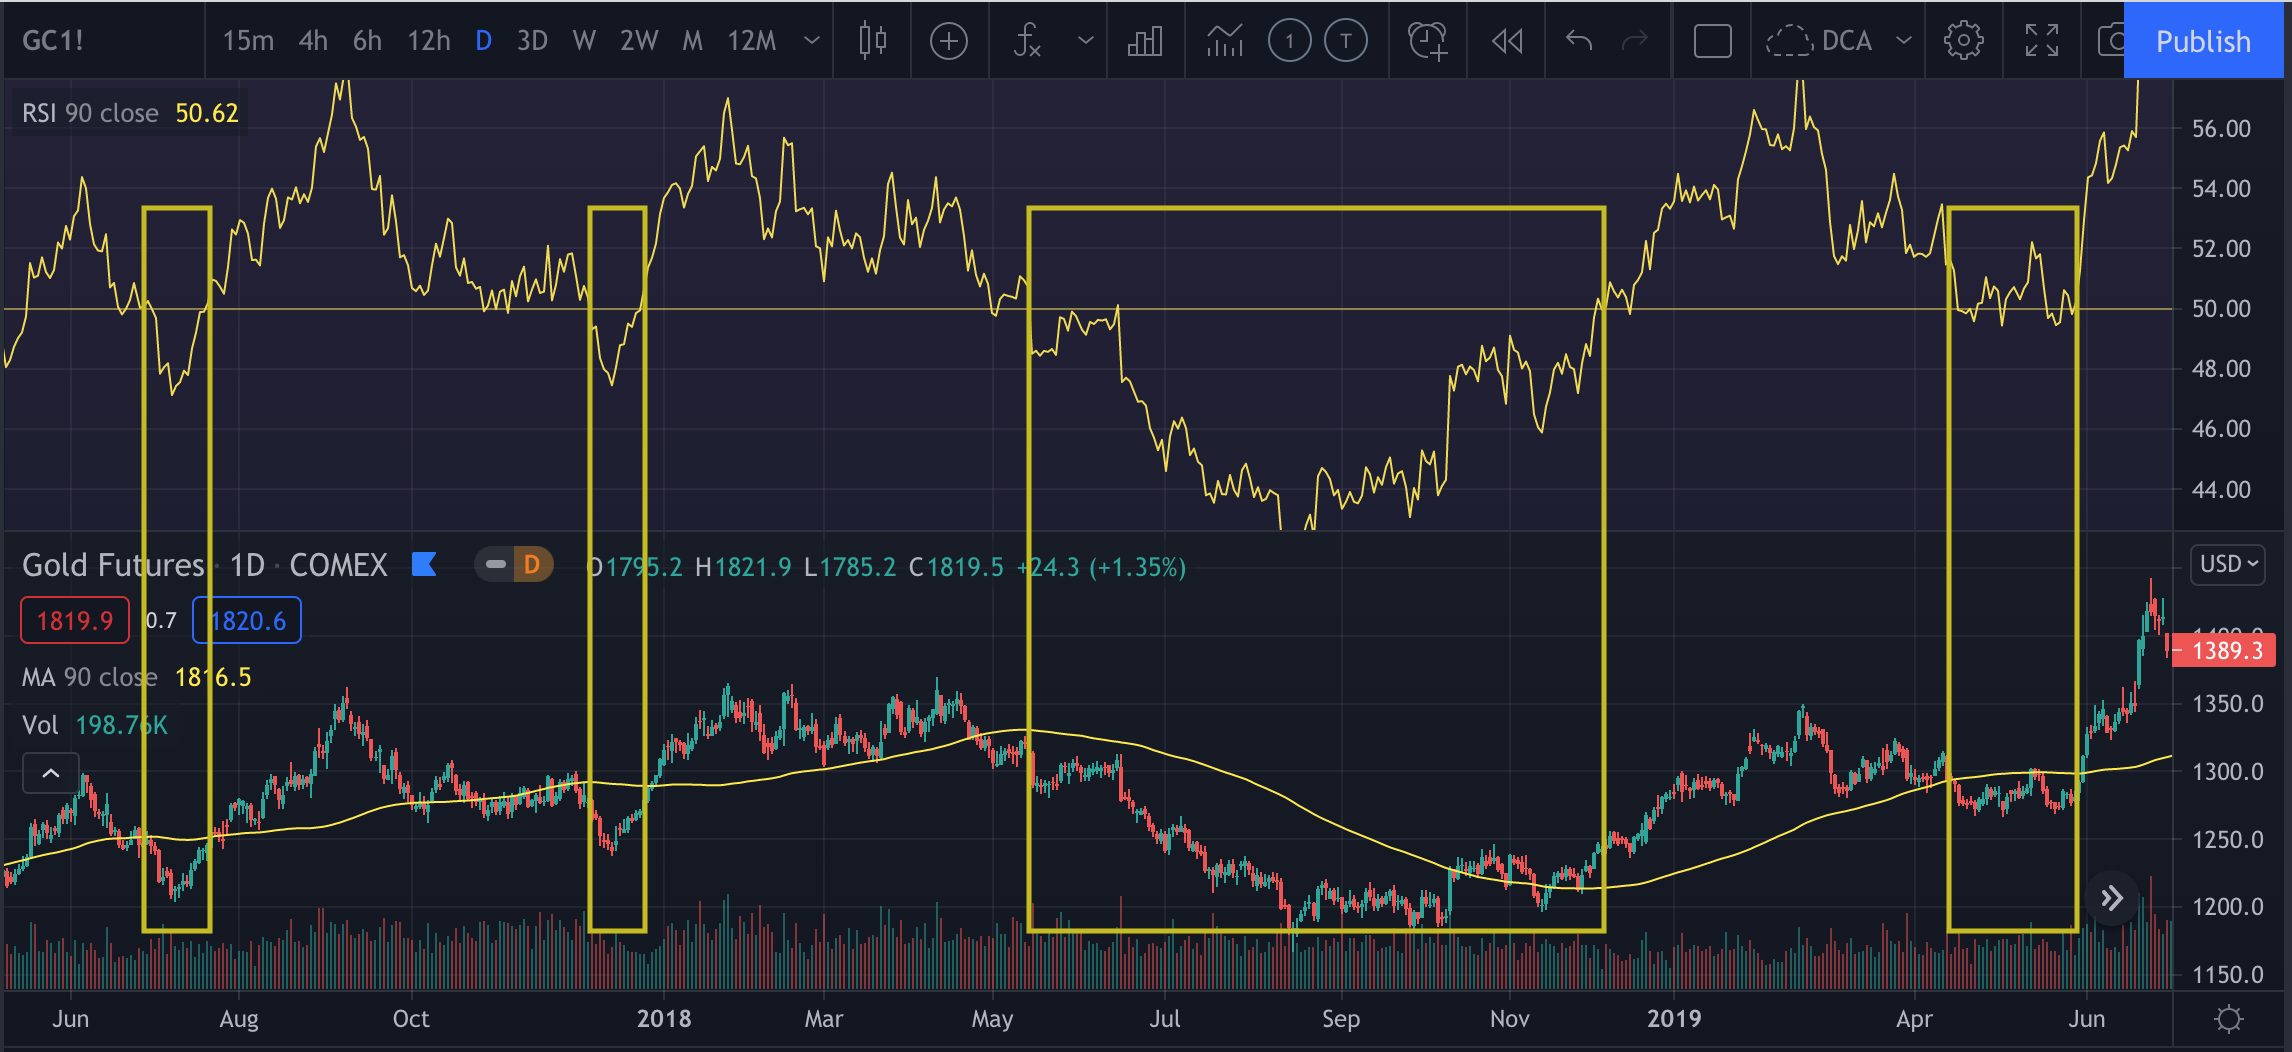
RSI is less than 50
Looking at the above, there are 2 frames, in the top frame is the RSI (90,CLOSE). When this line is below 50, purchase $15 worth of GOLD. If the line goes above 50, accumulate those daily contributions in a cash account. And here are the results:
Asset Accumulated: 4.51oz
Total Value: $8,105.00
Invested: $6,045.00
Profit: $2,060.00
ROI%: 34.08%
Cash on Hand: $13,125.00
~Yearly % Return: 6.82%
Incredible, this can’t be gold, surely not!
So from the simple strategy to this enhanced RSI version, there is a difference of 1.3x (34.08% vs 26.15%). On $1m, that’s about $300k more in returns over 5 years, and I’m sure you will agree, regardless of the investment amount, we want the best performing strategy.
“The RSI DCA version has the most superior ROI% for this data set”

Summary Table
In summary
I really hope you are all still awake, and thanks for taking the time to read this analysis. It’s pretty clear to me that DCAing when the price is down is a good idea. I’ve shown the analysis for 3 additional ways to DCA opposed to a Simple DCA strategy.
But before we go, I know there are some out there saying, but the simple DCA gives us over $24k of gold (13.46oz). The RSI version one has only $8.1k of gold (4.51oz). This may be true, but remember that you also have over $13.1K cash on hand. Had you invested the full amount available, you would have returned $25,7k, with a profit of $6,532.70 (thats $1,519 more).
The key to all three of the enhanced DCA methods, is that in all of them, you have cash on hand for other opportunities. Let’s say we like a crypto strategy, like “Rational Active Allocation Index” by momentum-analytics.io (as at Aug 2021 it has outperformed Bitcoin for 2 year’s since inception), you’d have the cash to DCA into that versus the $0.00 you’d have in cash with the simple DCA approach.
SOLUTION FOR your Gold DCA strategy
The question is, would you be happy with ~6.82% yearly returns on about $150 a month (about 1/3 of days invested in the enhanced methods). If the answer to this is yes, start your gold DCA strategy by allocating to the low fee XAU DCA Strategy (GOLD) - which gives access to 100% allocated gold bullion.(*)
(*) You will need to register on the ICONOMI platform before you are able to copy the strategy and you can find out more on PAXG here.
This blog is dedicated to Lesley S, it is never to late to DCA!
DISCLAIMER:
This publication is general in nature and is not intended to constitute any professional advice or an offer or solicitation to buy or sell any financial or investment products. You should seek separate professional advice before taking any action in relation to the matters dealt with in this publication. Please also note our disclosure here